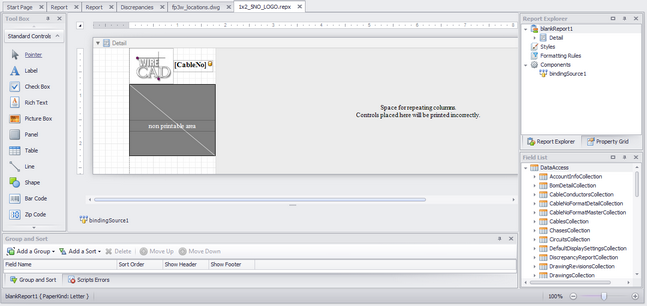
Visible only when the Report Designer Tab is active.


Any of these tools can be added to the report under design.
Menu Item |
Description |
||||||||||||||||||||||||||||||||||||||||||||||||
Pointer |
Selection tool |
||||||||||||||||||||||||||||||||||||||||||||||||
Label |
The most common tool. Can be used to display static text or if the text is held in square braces[]. For example: a label with the caption S:[SRCSys]>[SRCPin] will render S:SomeSrcSys>SomeSrcPin once for every record in the collection. |
||||||||||||||||||||||||||||||||||||||||||||||||
Check Box |
A Check Box is used to display True/False or Checked/Unchecked/Indeterminate values in a report. |
||||||||||||||||||||||||||||||||||||||||||||||||
Rich Text |
The Rich Text control allows you to display formatted text in your report. It can represent static or dynamic text, or both. In addition to the capability to embed plain text into your report (using the Label control), you may need to display RTF or HTML content as well. WireCAD does not use RTF or HTML natively but there is no reason you could not put formatted text in a user field. |
||||||||||||||||||||||||||||||||||||||||||||||||
Picture Box |
Picture Box is used to embed static (stored along with the report definition) or dynamic (obtained from a data source) images into a report.
It can display images of various file formats: BMP, JPG, JPEG, GIF, TIF, TIFF, PNG, ICO, DIB, RLE, JPE, JFIF, EMF, WMF. |
||||||||||||||||||||||||||||||||||||||||||||||||
Panel |
The Panel control is a container that frames separate report controls to allow them to be easily moved, copied and pasted, and visually unites them in the report preview (with borders or a uniform color background). |
||||||||||||||||||||||||||||||||||||||||||||||||
Table |
The Table is used to display tabular information in a report.
Note Table reports should not be confused with hierarchical master-detail reports or cross-tab reports.
You can create two tables simultaneously, e.g., one for showing column titles in the Page Header, and the other for showing regular information in the Detail band. |
||||||||||||||||||||||||||||||||||||||||||||||||
Line |
The Line control draws a line of a specified direction, style, width and color. It can be used for both decoration and visual separation of a report's sections. Note that the Line cannot cross bands. |
||||||||||||||||||||||||||||||||||||||||||||||||
Shape |
The reporting engine provides you with the capability to embed shapes into your reports. You can simply add an Shape control to a report, choose one of the available shape types, and then print or export this report. The following shapes are available:
|
||||||||||||||||||||||||||||||||||||||||||||||||
Bar Code |
A Bar Code object. The supported bar code types are:
|
||||||||||||||||||||||||||||||||||||||||||||||||
Zip Code |
The Zip Code control transforms its content into a zip code. To specify the text for the control, use the ZipCode.Text property. Note that the Zip Code control can only display numeric characters and dashes. Other characters are displayed as empty zip boxes. |
||||||||||||||||||||||||||||||||||||||||||||||||
Chart |
The Chart control visualizes the series of points using the available 2D chart types or 3D chart types. The chart type is defined via the View property of a series. And, a single chart can display multiple series, if their view types are compatible. A Chart contains multiple visual elements (diagram, axes, titles, labels, strips, constant lines, etc.) and, when any of these elements is selected, its properties are shown in the Property Grid. |
||||||||||||||||||||||||||||||||||||||||||||||||
Guage |
The Gauge control provides you with the capability to embed graphical gauges into your report. |
||||||||||||||||||||||||||||||||||||||||||||||||
Sparkline |
The Sparkline control displays a compact chart that is commonly used to reflect the flow of data for every row in a report. |
||||||||||||||||||||||||||||||||||||||||||||||||
Pivot Grid |
The Pivot Grid allows you to create a pivot table, an Excel-inspired data visualization application for multi-dimensional data analysis. Using the Pivot Grid, large amounts of data can be summarized and represented in a cross-tabular format that can be sorted and filtered. Also, since the Pivot Grid provides customization you can freely change the layout of the report based on your analysis requirements, using simple drag-and-drop operations. It also supports drill-down (to view the underlying data for calculated cells). |
||||||||||||||||||||||||||||||||||||||||||||||||
Sub-Report |
The Sub-Report control is used to embed reports into each other; this allows you to create Master/Detail reports (reports with hierarchically linked data). |
||||||||||||||||||||||||||||||||||||||||||||||||
Table of Contents |
The Table of Contents control allows you to provide your report with a table of contents that reflects the hierarchical structure of the report bookmarks. |
||||||||||||||||||||||||||||||||||||||||||||||||
Page Info |
The Page Info is used to display auxiliary information on report pages, such as date, time, page numbers or user name. |
||||||||||||||||||||||||||||||||||||||||||||||||
Page Break |
The Page Break control's sole purpose is to insert a page delimiter at any point within a report. This control is visually represented by a short line, attached to the report's left margin. The Page Break control is useful when you need to insert a page break between controls within a report band - for example, to divide subreports, so that the second subreport starts printing on a new page.
You can also insert a Page Break before or after a specific report band using the Band.PageBreak property. |
||||||||||||||||||||||||||||||||||||||||||||||||
Cross-band Line |
Cross-band controls are used to draw lines and rectangles through several bands, as opposed to Line and Shape controls that can be used only within a single band. The following two cross-band controls are available: Cross-band Line allows for the drawing of vertical lines, which are not restricted to a particular band. For example, it can be used to emphasize a report section consisting of multiple band areas. Cross-band Box allows for the drawing of rectangles through several bands. It can be used to encompass a report section consisting of multiple band areas. |
||||||||||||||||||||||||||||||||||||||||||||||||
Cross-band Box |