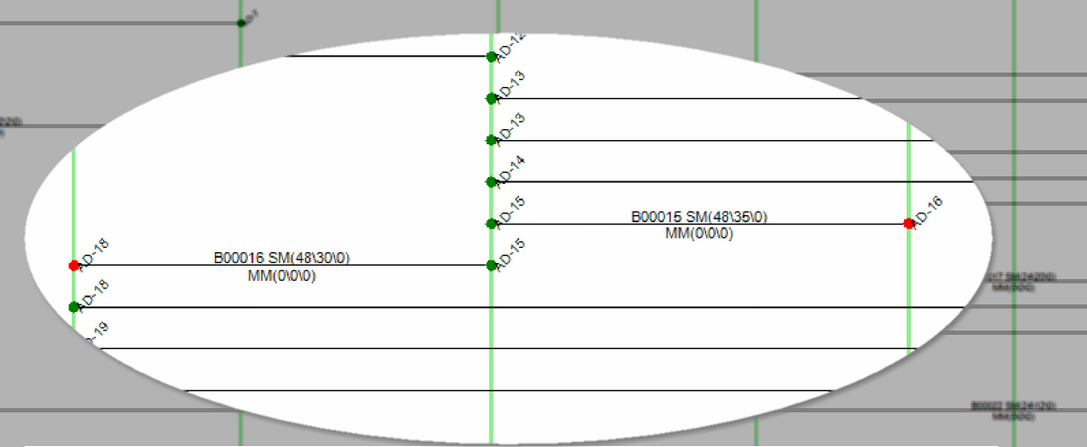
The Backbone Visualization tool creates a layered digraph showing the backbones horizontally and the locations in which they originate and terminate vertically.
The backbones displayed, and many of the display parameters can be set using the [Visualization Settings] tab.
